Dreamgrow is reader-supported. When buying products through links on the site, we may earn a commission (at no extra cost to you).
Content marketing can be a daunting task of producing fresh epic content day after day.
Quantifying the results will help you motivate yourself and your team. Measurable results point you in the right direction and help convince stakeholders. Clear numbers also make it easier to decide what content you need to create.
I will give you a list of key performance indicators that measure content marketing ROI.
Clear metrics will help you understand what is working in your content marketing (and what activities you can cut).
TL;DR
The basic content marketing KPIs in Google Analytics don't measure what you think they do. What to consider when you analyze them. How to fix the metrics to get a better understanding of your content's performance.
Visits – measure engagement by source, time on site, and conversion rate (Sessions in Google Analytics).
Readers – measure engagement by source, device, repeat visits, time on site, and conversion rate (Users in Google Analytics).
Time – fix how you measure time on your site.
Bounce – make bounce rate a more meaningful metric that measures engagement.
Content Marketing KPIs on your site
The content marketing metrics on your site come in two levels:
The specific piece of content. One article, image, infographic, white paper, podcast, video, etc.
The total results of all the content on your site combined.
First, let's start with content marketing KPIs for single pieces of content. Let's call these pieces of content posts but keep in mind that the post can be any of the following:
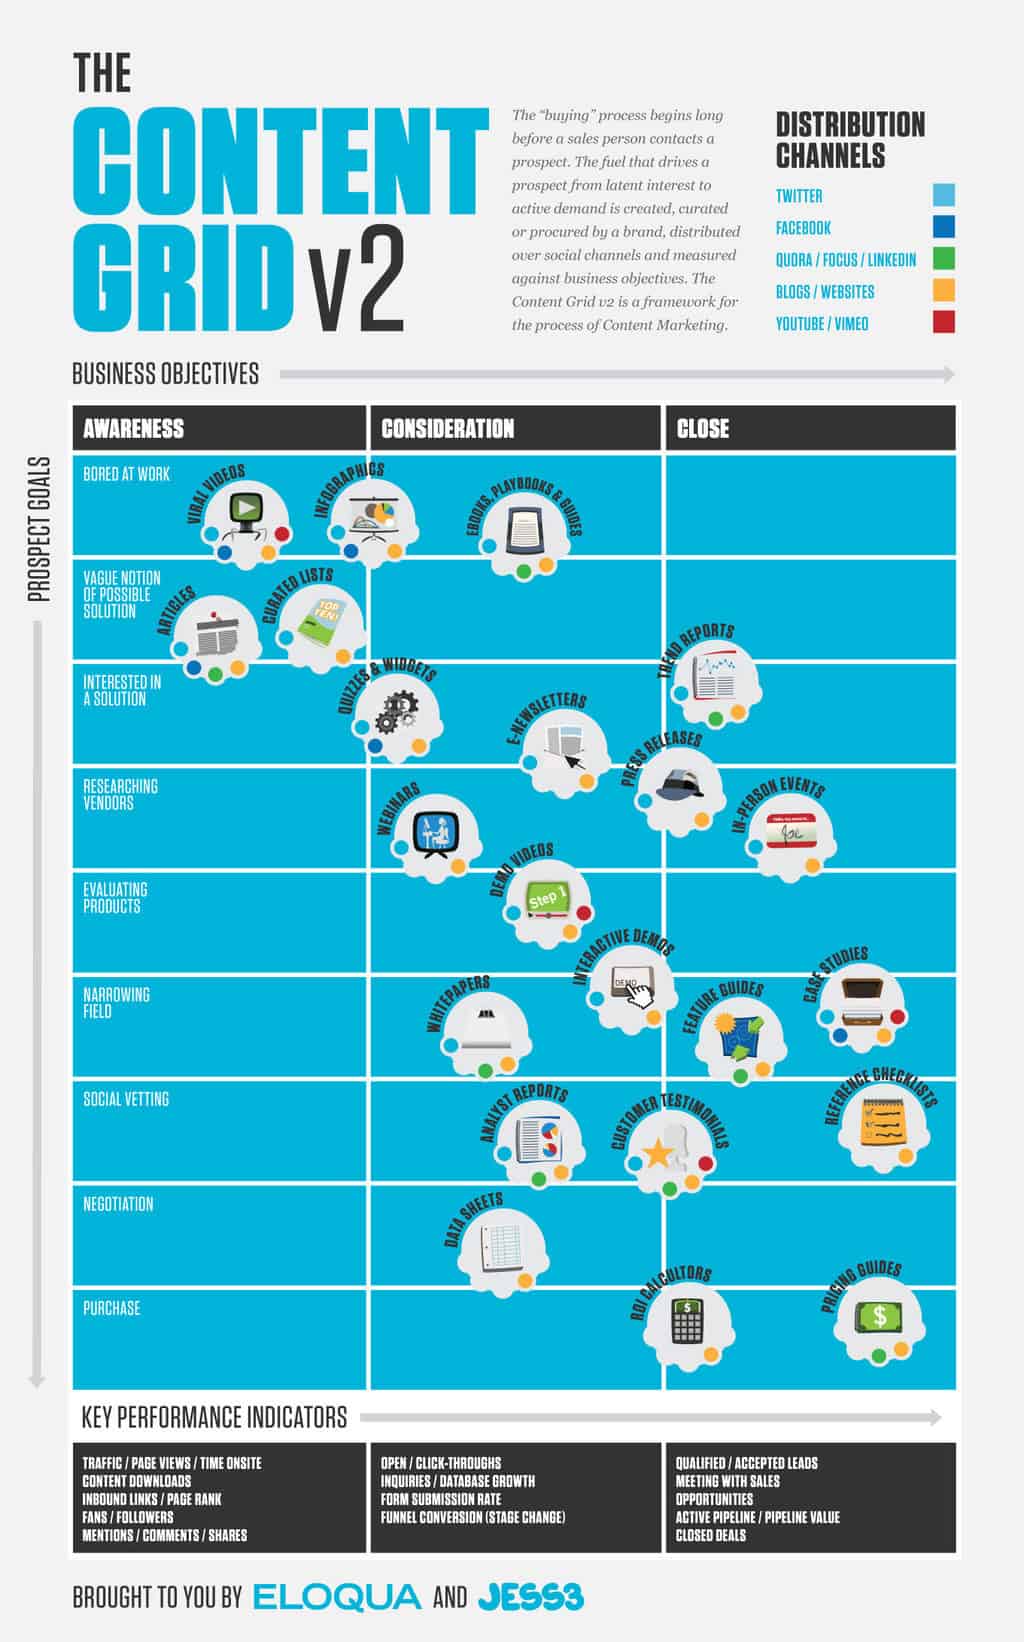
Blog Posts, Images, Videos, Slides, Infographics, Podcasts, Whitepapers, Courses, Ebooks, Guides, Curated lists, Quizzes, Widgets, Online Tools, Press releases, Trend reports and stats, Webinars, Case Studies, Testimonials, etc. You can get a general overview of different types of content from this post The Content Grid: Content Marketing in a Blink.
The easy to measure content marketing metrics
The basic content marketing KPIs are easy to measure.
You can get them from any analytics program. This also means that you need to understand how to use these numbers.
Let's start with the most basic KPI for a piece of content.
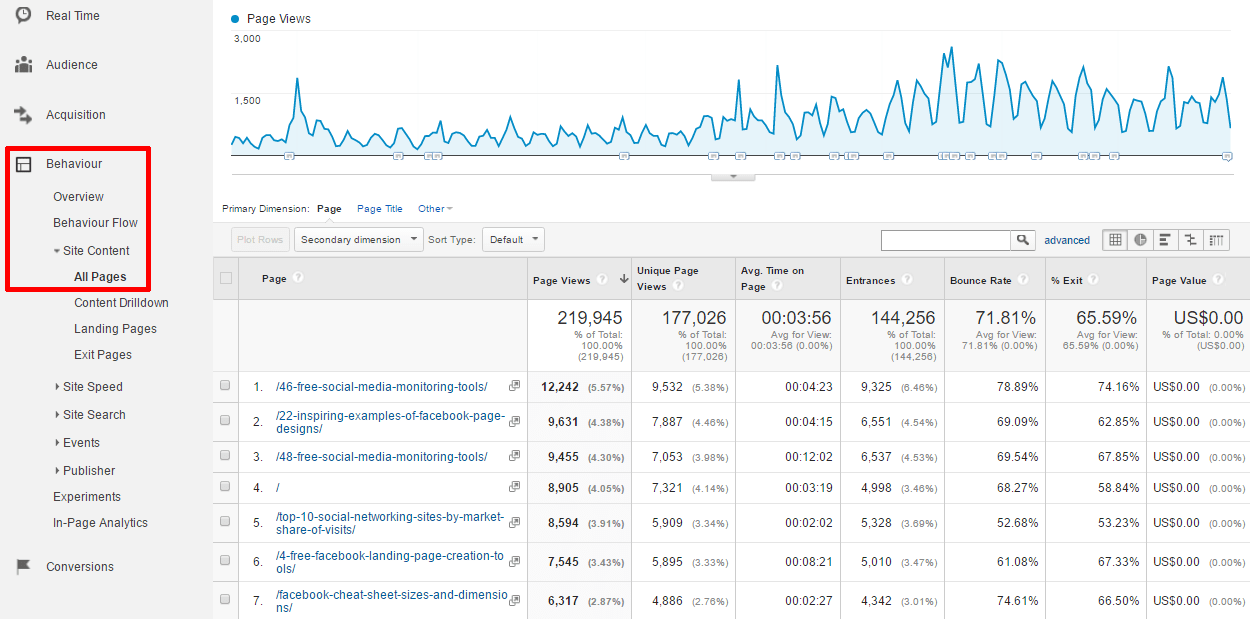
The most basic overview of the content of your website is in the Google Analytics report Behaviour > Site Content > All Pages.
This report will give you an overview of what are the most popular pages on your site and not much else. In the standard Google Analytics configuration, this table is not well-connected with reality. I will give you tools to fix those metrics (average time on page and Bounce rate).
But first, let's take a look at most widely used content metrics. How to make sure you measure things that make sense and relate to your marketing strategy.
Visits or Sessions
Website visits (or sessions) to a specific post. In Google Analytics website visits are called Sessions. Sessions measure the number of times your content has loaded into people's browsers. One user can make many visits to your site.
The important thing about visits is that you don't know who the visitors are. If the type of your visitors remains constant, then steady growth is a good thing.
But there's a catch.
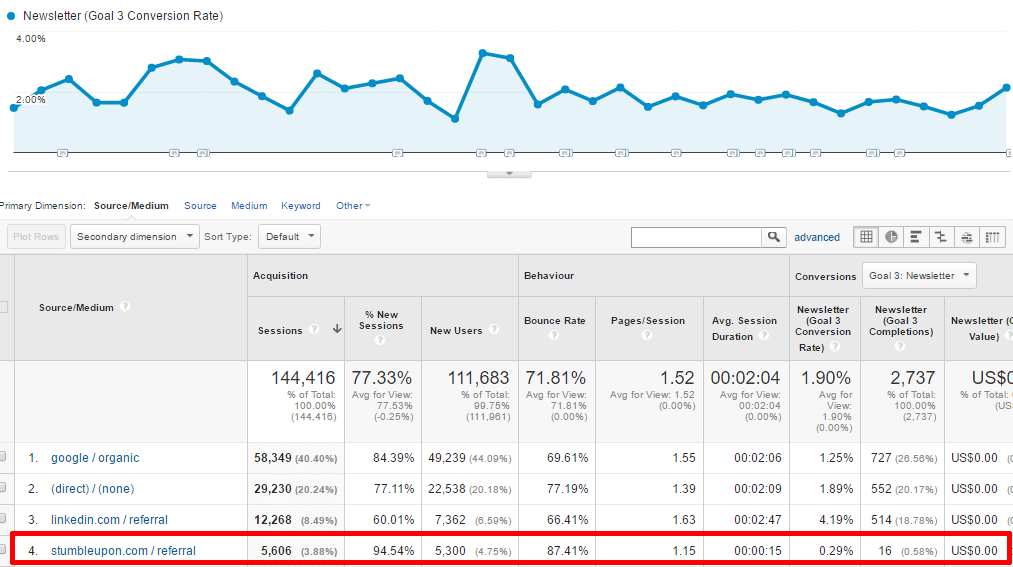
The value of a visit depends a lot on the channels people are coming from. You should break down visits by channels and compare them by more tangible metrics.
In this example, our site's average email list subscription rate was 1.90%. Then we get a lot of visits from StumbleUpon the conversion rate is only 0.29%. It's nice to see numbers peak but keep your eye on the real value.
Just by itself, visits don't tell you much.
The questions you need to answer: Who are the visitors? Did you get any value out of these visits?
The screenshot above is the Acquisition > All Traffic > Sources/Medium report in Google Analytics.
It will show you the basic metrics by channels and campaigns. You can zoom in on a single channel by clicking on them.
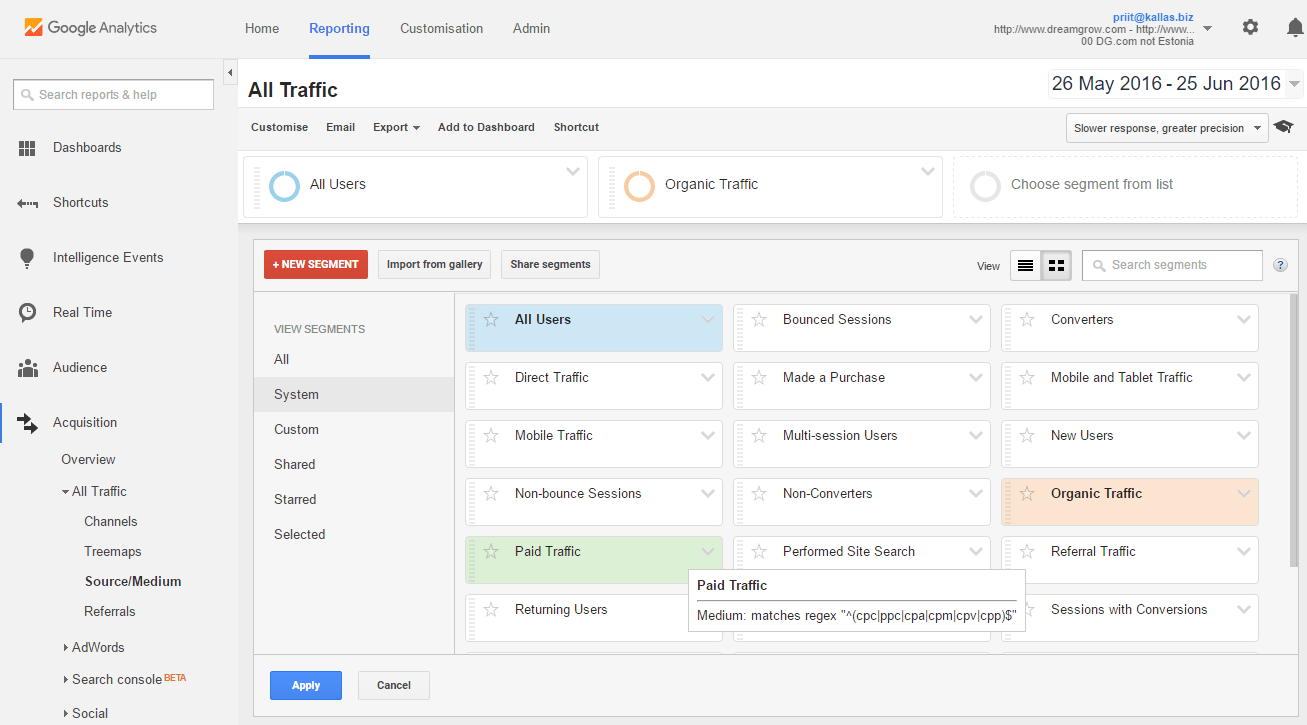
However, if you want to analyze visits only from a single channel, then you can use segments to do that.
Segments are available on the top of almost every report. You can open the segment selection by clicking on the “+ Add Segment” next to default “All Users”.
Use the ones already in the System or create your own Custom segments to fit your needs.
Readers are measured by devices and browsers
Readers or viewers are called Users in Google Analytics. Another term used is Unique Visitors.
In reality, this is a cookie in a user's browser, and this complicates things a bit. A cookie lets you count them using your site with their browser. But if they use several different browsers, you get a user for each browser.
On the other hand, if different people use the same browser Analytics counts one user.
Most people use just one browser on their computer. But they most certainly use a smartphone and possibly a tablet. Multiple devices make one person show up as three users in your stats.
In some cases, I have seen an increase in users to a website. But when we look into it, we see the same people using the site on different devices.
On some websites, you can connect data from many sessions and devices. Cross-device tracking will only work if you can identify users on your website. You can assign them a User ID when they log in to your site on different devices. Implementing User IDs will let you see the conversion process from start to finish.
If your users don't log in, then your data will remain fragmented across devices and browsers. You can find out more about Cross Device reports and Setting up the User ID from Google.
Time spent on content and why it's wrong
In Google Analytics you can see Average Time on Page. Well, guess what? It's wrong. The thing is that Google Analytics tracker in its original configuration can't measure time.
When you land on a web page Analytics will record the time. Let's say your visit looks like this:
12:00:00 you load the home page. You spend 1 minute looking for what you need.
12:01:00 you click on a link that takes you to the best content in the history of content marketing. You spend 1 hour reading the awesome content.
13:01:00 you close the browser window and leave the site.
What do you think how long is the visit recorded in Google Analytics? 1 hour and 1 minute, right? Wrong! It's 1 minute… but Analytics will tell you that you spent ZERO seconds reading the most awesome content.
The reason: Standard setup of Google Analytics does not have a stopwatch. It can only measure time between page loads and events. In this case time between the first and second page load is 1 minute.
How to fix time spent on site?
Fortunately, there are several fixes to measure time better.
One of the simplest ones is Riveted. WordPress users are in luck! Just install the Riveted plugin you are set to measure real content marketing KPIs.
If you don't use WordPress, then you can use Riveted as a piece of JavaScript code that you need to embed on your site. What will Riveted do for you?
Riveted measures the time users are engaged on your site. In this case engaged means clicking, scrolling, using the keyboard. It then reports this data to Google Analytics.
It supports Universal Analytics, Classic Google Analytics, and Google Tag Manager. You can also use it with any analytics tool that supports events, e.g., Mixpanel or Keen.io.
Here is another way to measure content engagement time with Google Analytics:
It is pretty technical but gives you useful statistics on your content. You may need help from your developer to pit it in place this but it’s totally worth it. You get:
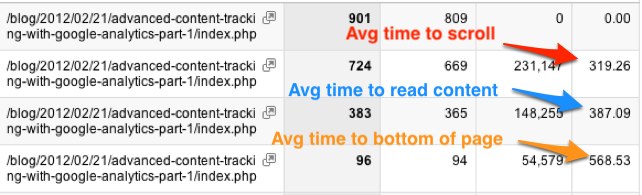
Article load: Measure how many times the article loads in a browser. Basically another count of page views. This will provide context to the other events that we track.
Start Reading: Track when a visitor starts scrolling down the page. This triggers after a visitor scrolls 150 pixels down the page. You can change this value to match your needs. I’m also tracking how much time it takes to start scrolling.
Content Bottom: Track when a visitor reaches the end of the article content. And track how much time it took between the scroll start and getting to the bottom of the content.
Page Bottom: Track when the visitor reached the button of the page and how long it took.
With this tool you can get overview of how your content is doing.
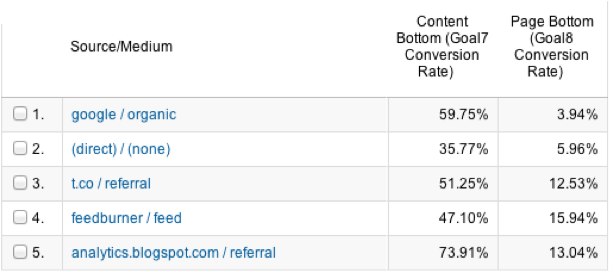
Dig into engagement metrics of a specific post:
You can create goals with these events in Google Analytics. This lets you understand how users from different channels read your content:
Why bounce rate is a bad metric?
I hate bounce rate!
It has long been a go-to metric for visitor interest and engagement. It's not!
Bounce rate as measured by default in Google Analytics tells you just one thing. Visitor visited one page. As Google Analytics can't measure time, this bounced visit will have a length of zero seconds.
Often marketers see this as a bad thing. Content didn't engage enough to make the visitor go deeper into the site. Get this! The number of pages is not a measure of engagement!
Here's an example why you shouldn't use bounce rate as a measure of engagement:
Quick mental calculation told me that this post would take me several hours to read. I set aside time to work on this post, it took hours, and it engaged me… a lot.
Now, if you look at that visit in standard Google Analytics you will see a zero second bounce visit. As I visited that page on several occasions, this will drag down the total metrics of the site.
Google Analytics inability to measure 1-page sessions leads to a situation like measuring water temperature on the beach with the air temperature at your office.
Yes, there might be a correlation, but most likely it's off.
Sites with popular blogs may have bounce rates upwards of 75%. Visitors come to read a new post and leave. But a small site with a home page, product catalog and nothing else may have a bounce rate of 20% or less.
In this case, people land on the front page. Look around. There’s nothing there, and the only option is to click through to the product catalog.
Yay! A non-bounce visit!
All that being said, you should keep an eye on the bounce rate just to track the health of your site. Sudden changes in bounce rate show that something unusual is happening.
Large changes in bounce rate usually indicate problems with the site or Google Analytics.
A low (0-2%) bounce rate usually means that your Analytics code is not correctly implemented. For example here are the changes of bounce rate on our site over the years:
How to fix bounce rate?
You already did! The tools that help you measure time correctly will also fix your bounce rate.
When a person arrives at your site and loads the first page, Google records the time.
Now, when you generate an event, this will no longer be a bounce visit.
The first event might be when the user scrolls to the 200-pixel mark. Google will record the time of the event and these two points in time give you the length of the visit at that moment.
As you continue to generate events on a single page visit, the duration of the visit is growing.
Length of the first scroll
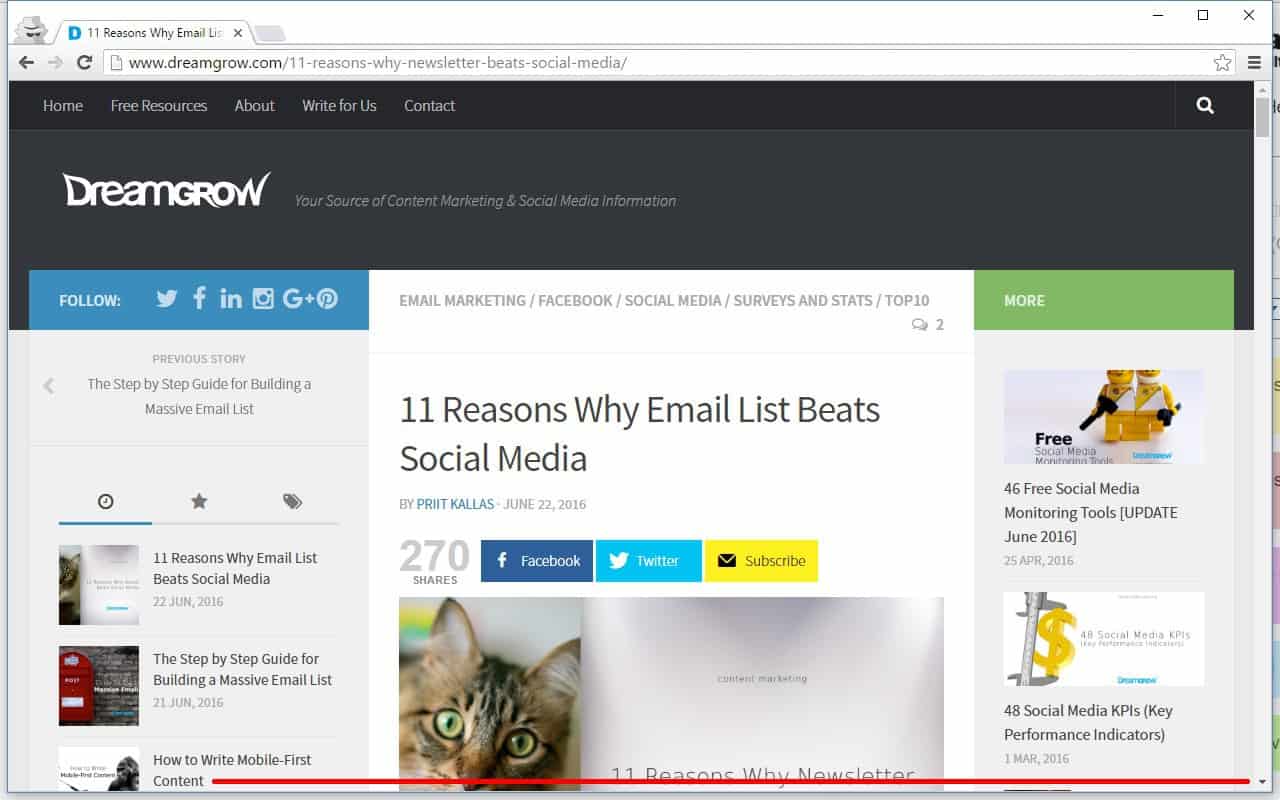
How to set the number of pixels for the first scroll length? It should be large enough that significant amount of content appears on the screen. For example, let's take a look at one of our blog posts: 11 Reasons Why Email List Beats Social Media.
I set my screen to 1280×800 pixels. This will cover most of the desktop user screens. The first time the page loads it looks like this:
I mark the bottom of the page, and I scroll down enough to see the first few lines of content. Now I will measure the distance between the two positions and use that as a metric for the first scroll.
In this case, the length of the scroll is about 640 pixels, and I will use that in my first scroll settings.
Bottom line?
Get your basic content marketing KPIs fixed in Google Analytics. Fixing the content marketing KPIs will give you a better understanding of what works well and what should be improved.
Visits – measure engagement by source, time on site, and conversion rate.
Readers – measure engagement by source, device, repeat visits, time on site, and conversion rate.
Time – fix how you measure time on your site.
Bounce – don't worry about bounce rate, measure engagement.
That's not all…
There are some signs that bounce rate and time on site are factors in how Google ranks sites. I only have anecdotal evidence of this from the sites I manage. But I have seen a drop in Google traffic when bounce rate goes up and time on site goes down. After I fix bounce and time, the traffic from Google comes back.