I want to thank everybody who visits this site. In May we had huge growth and reached 30,352 visits (this post was originally written a long time ago).
The milestone made me look back to see how we got here. I'll show you how blogging activity and number of posts are related to visits.
The original title of this post was rather boring: The effect of blogging frequency and post volume on traffic.
First visits to this blog dates back to April 26, 2009, but then there really wasn't any consistent plan behind this site.
I had blogged before quite successfully in Estonian, however I wasn't sure if my English was good enough. But then around August-September 2009, I started to put some effort behind the site.
And… guess what, visitors started to come.
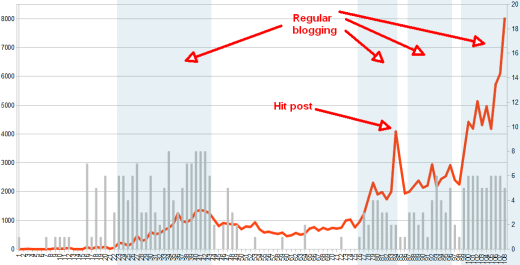
As you can see from the graph, the numbers were pretty low. The average visitor count for the first eight active weeks was 75. From there onwards it was mostly up until we reached the then unbelievable 1,247 visits per week.
I decided to write a blog post every single day, weekends included. About a month after that we reached another peak of 1,353 visits per week.
And then, we promptly stopped blogging.
The reason? Too much “real” work servicing our clients in Estonia and spreading our knowledge in conferences and seminars.
In hindsight, it looks like a great experiment, blog like crazy for half a year and then stop. See what happens.
Well, for some reason visitors didn't come as often as they used to and in mid-June 2010, the visitor count was three times lower than at its peak with only 453 visits per week.
Now another interesting thing happened with no work from our part the site started to gain visitors. I didn't notice this increase at first because I didn't check stats at all during that time.
But then by the end of September 2010, we had grown into a mighty company with almost 10 people. This allowed me to take some time off from day to day stuff and concentrate on the blog again.
First thing I noticed was the miraculous growth on autopilot. You probably guessed it, Google. Google had decided that this site is probably there for long-term and started to send us more traffic. Here you can see how domain age influences the results.
From the beginning of October 2010, we were back on track with some 3-4 post per week and this time the numbers really shot up.
Within four weeks our visitor count went through the roof to the level that we had seen only in sci-fi movies. Two thousand and three visitors per week!
Of course, if you see numbers like that you can just lay back and relax. Nope! You have to keep pushing out good content. (But you don't have to if you know what people want).
On November 29th 2010 I released our most visited post to date 22 Inspiring Examples of Facebook Page Designs. It took the site to another dimension as we went to 4,082 visits that week.
Again, sit back and relax.
For two weeks we pretty much didn't post anything noteworthy. Then the speed of dropping traffic made us afraid that we might break the X-axis in Google Analytics.
Back to random blogging with one to four posts per week. However by that time the site had enough traction that even this made us grow.
From then on to mid-March 2011 the visitor numbers were comfortably between 2,000 and 3,000 visits per week. Again, stop blogging! I had a vacation, 10 days of snowboarding in Austria.

But then I made a decision that we will post six times a week (Saturday is a day off) and maybe skip one now and then when we have a special event like sending out a newsletter.
As you can see we went from 2,243 to 8,035 visits per week in two months (10 weeks to be exact). All this culminated with 30,352 visits in May 2011. Thank you!
Lessons learned
I hope you see a pattern here. Post more frequently and you get more visitors. Stop and they will go away.
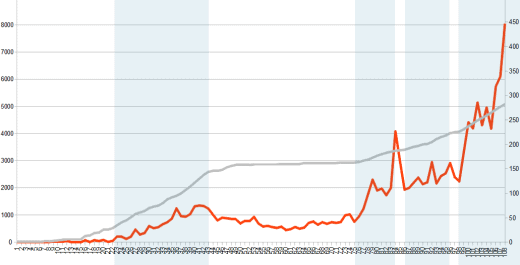
However the amount of posts that you have will increase the level of “background” visitors from search engines. As you can see on this graph the absolute number of post correlates pretty well with the amount of traffic you are getting.
The time frame for this graphs is 108 weeks from April 26 2009 to May 21 2011.
I believe that the frequency should be at least a few posts per week. But it's very important to be consistent in your posting schedule.
Try to write blog posts that work long term posts. If it's time sensitive then the effort will be somewhat wasted. We have blog posts that bring in traffic month after month and even increase in time as they get more and more links.
If you write less frequently aim for better quality. We have some blog posts that bring in 500 to 1,000 visits every week (for a very long time). So you only need a dozen or so these types of posts to get to 10,000 visits per week.
Of course, this is only hypothetical as you will need some content volume for search engines.
Ask for help. If you have friends or colleagues ask them to share, like, tweet and spread the word in all social channels. Ask them for links.
If you are not a one man band as your non-blogging coworkers to get out of the comfort zone an write a post or two per month. If you have an intern make them blog!
Find out if someone wants to guest post to your blog.
Find out who are influential in your field on Twitter and other social site. We had a lot of help from tweeple with large number of followers.
Post about topics that you truly believe will be useful and help your readers. You don't have to write thousands of words, sometimes a SlideShare presentation or YouTube clip is all you need to make your readers happy.
This is post number 295 in this blog. Next wee we will break the 300 post barrier. 270 of these posts are written by yours truly (in some cases translating our Estonian posts by our team members). 15 remaining posts are written by:
- Jaan-Matti Lillevälja
- Martin Raadik
- Annes Org
- Raul Kaevand
- Thomas Morrison
I think the next few months will be below 30 thousand visits, vacations coming up and all that. But come fall we reach for new heights. Thank you for reading! Of course, sign up for our newsletter in the right column, follow us on Twitter and get the RSS feed.
UPDATE: From 2012 to 2018
We wasted a lot of time!
Since the writing of this post in 2011 Dreamgrow.com traffic quadrupled to almost 130 thousand visits in March of 2012. And then we ditched everything!
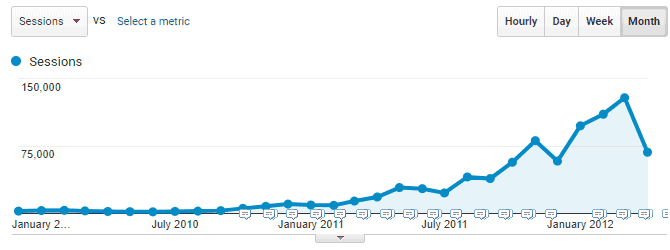
Initially, we built this site to sell a SaaS product based on the Facebook platform. Then Facebook platform change made our service virtually useless. When this happened the motivation to continue crashed.
On top of that, we got penalized by Google and saw our search traffic drop by more than 50% at the same time.
We then all but stopped working on the site. It took almost 3 years to get from 130k visitors per month to 13 thousand in the June of 2015. It really takes time to wind down if you have a lot of traffic.
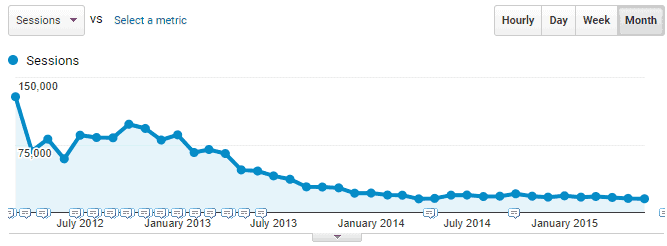
In July of 2015 I started working on the site again and now 2, and half years later the traffic numbers are higher than ever. We will break 200 monthly visits in the next few months.
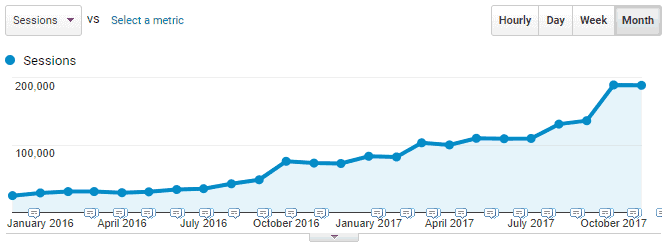
This graph shows data from December of 2015 to now. We lost some months of data due to misconfigured Google Analytics.
But this is a story for another blog post. But as you can see the process is repeatable.
Some other blogging related posts:
- 22 Blogging Tips That Will Get You More Visitors
- 20 Steps to Write a Blog Post
- Why Businesses Need to Blog?
__________________________
Image credit Luc De Leeuw

